


BIX ARTICLE
New Features on BIX Malaysia
Sep 04, 2020
|
7 min read
Featured Posts
Social Bonds Illustrative Use-Of-Proceeds Case Studies Coronavirus
Jul 06, 2020
|
2 min read
Sustainable Banking Network (SBN) Creating Green Bond Markets
Jul 06, 2020
|
2 min read
Why is Inflation Making a Big Comeback After Being Absent for Decades in the U.S.?
Mar 24, 2022
|
7 min read
SC issues Corporate Governance Strategic Priorities 2021-2023
Mar 29, 2022
|
3 min read

Compare Yield Trends Between Different Bonds and Sukuk with Yield Chart and Export Data from BIX Website to Excel
Yield Chart: Track the yield trend and compare the yields between two different bond or sukuk.
The yield chart function allows BIX users to see the trend of the traded yield of a bond or sukuk security over time. There are options to see the yield trend within a specific timeframe ranging from the last 1 month to since the inception of the bond and sukuk.


When the Yield Chart timeframe was set to Since Inception as shown in the Figure 2 above, we can see that this DRB-HICOM sukuk’s traded yield has declined by 12 basis points from 12 December 2019 to 10 August 2020.

BIX users can also compare the yield chart against other bonds or sukuk either issued by the similar issuer or different issuers. To compare the yield chart, users can click “Compare Chart” icon as shown in the Figure 3 which they can choose different bonds or sukuk by category (Government or Corporate), or they can type in the issuer name of other bonds or sukuk. For example, let say users want to compare the DRB-HICOM IMTN 4.150% 12.12.2022 sukuk with another sukuk issued by GAS MALAYSIA BERHAD. After type in the issuer name and hitting the Search button, all bonds or sukuk issued by GAS MALAYSIA BERHAD will be listed as Figure 4 below.

This Compare Chart function is limited to comparing two different bonds or sukuk at a time. So, users need to choose only one bond or sukuk from the list. For example, users can choose GASMSIA IMTN 3.520% 13.12.2022 from the list, and then hit the Compare button to compare the traded yields with DRB-HICOM IMTN 4.150% 12.12.2022

Figure 5 shows that the yield movement of DRB-HICOM sukuk is more volatile than the GAS MALAYSIA sukuk within a 1-year timeframe. Over the last one year, the GASMSIA IMTN 3.520% 13. 12.2022 yield has been moving steadily downward. The dots along the yield chart lines indicate that the DRB-HICOM sukuk are more frequently traded compared to GAS MALAYSIA sukuk.
This yield chart can be exported as an image from the BIX website to the user’s computer by clicking the Export as image button.
Export to Excel: Export Bond and Sukuk Securities Information, Rating Movements, and Trading Activities Data from BIX website to Excel.
Export to Excel button has been added to the BIX website, which enables users to export the bond and sukuk security information, rating movements and trading activities data from BIX website to the Microsoft Excel. The security information of an individual bond or sukuk on BIX website includes its stock code, issue date, profit rate, residual tenures, and some other information. Rating movements gives historical information on the rating changes of the bond or sukuk, if any, by rating agencies, while the trading activities give information on the yields traded, prices, amount of trades, and trade date. The Export to Excel function provides convenience to users doing data analysis in Excel when using BIX website as a source of information for Malaysia’s bond and sukuk.

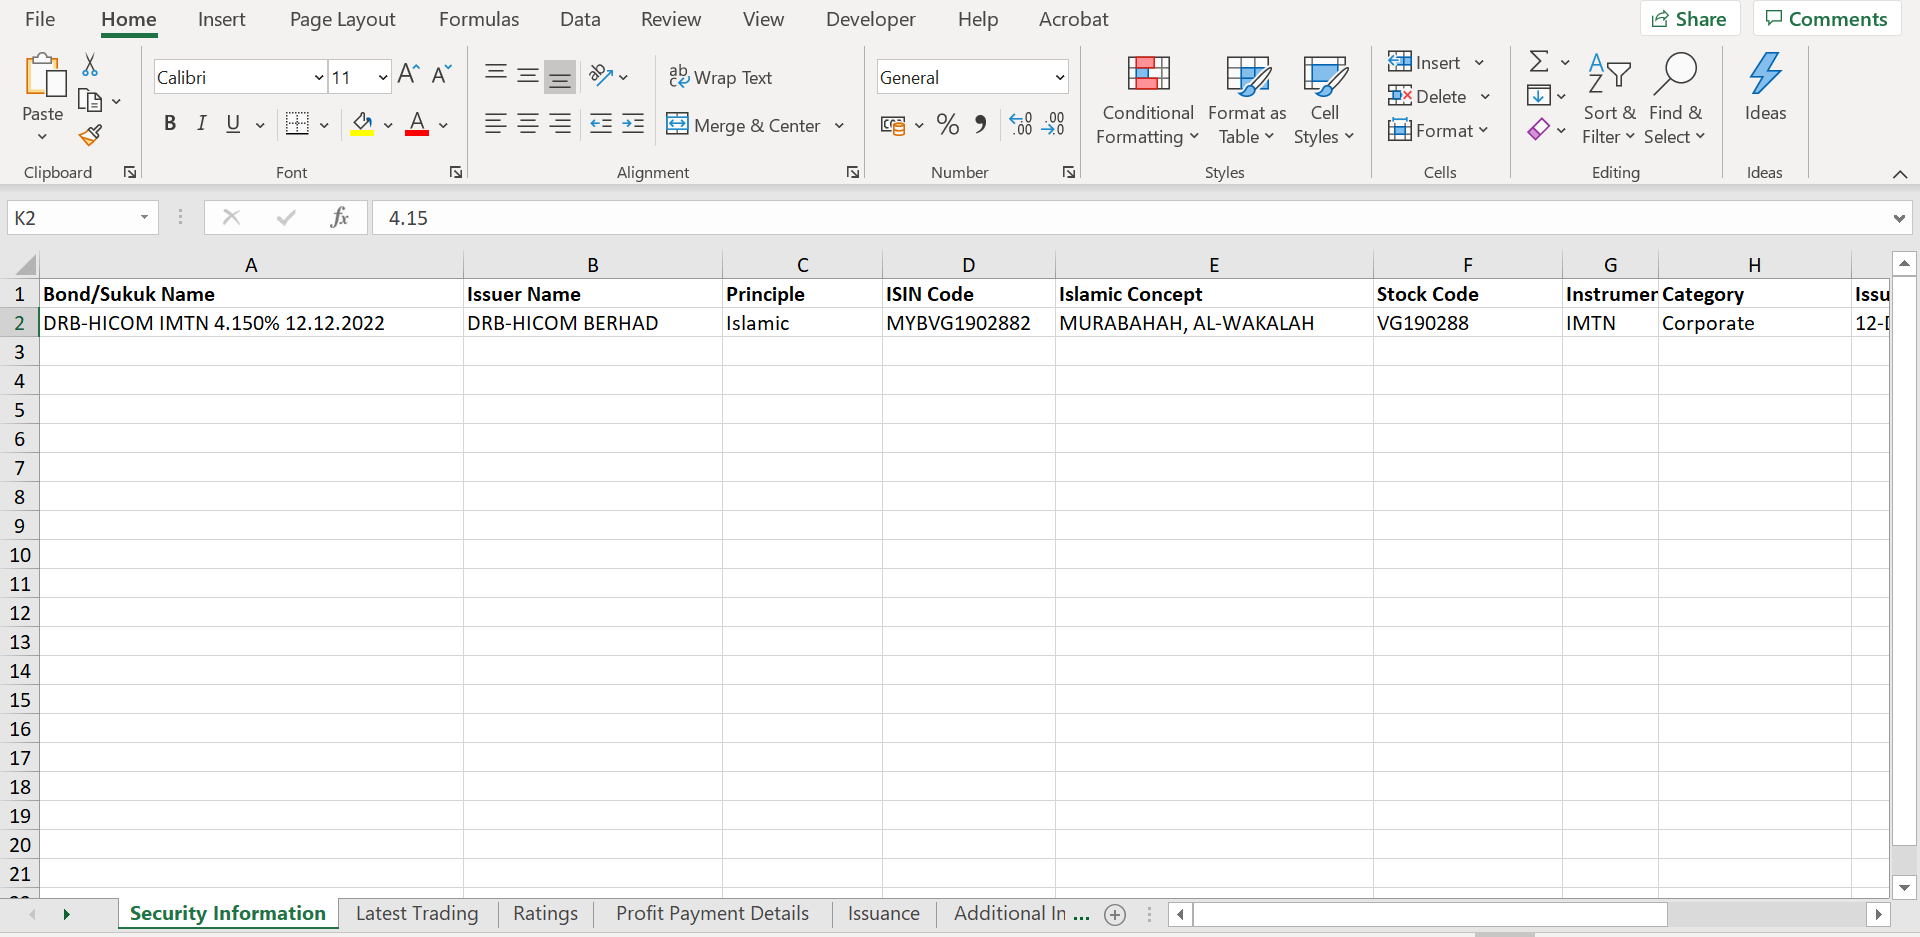.png "Figure 7: Security Information Exported to Excel")

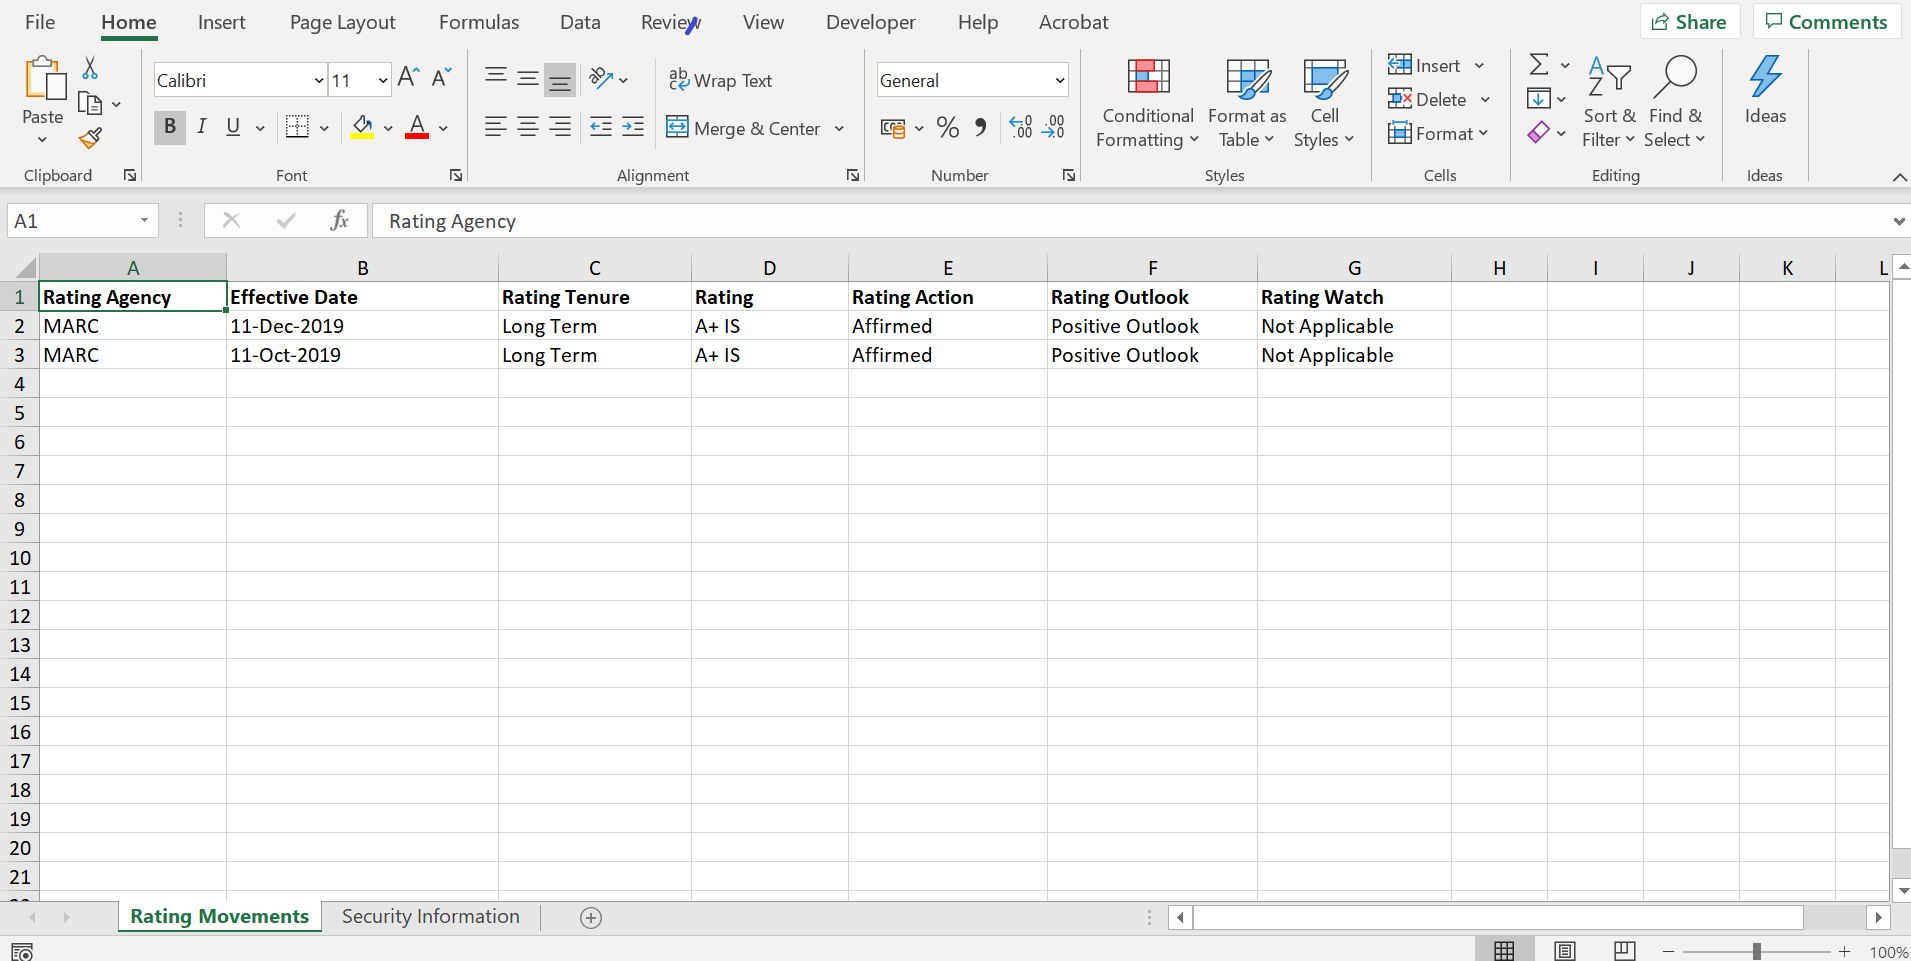.png "Figure 9: Rating Movements Exported to Excel")

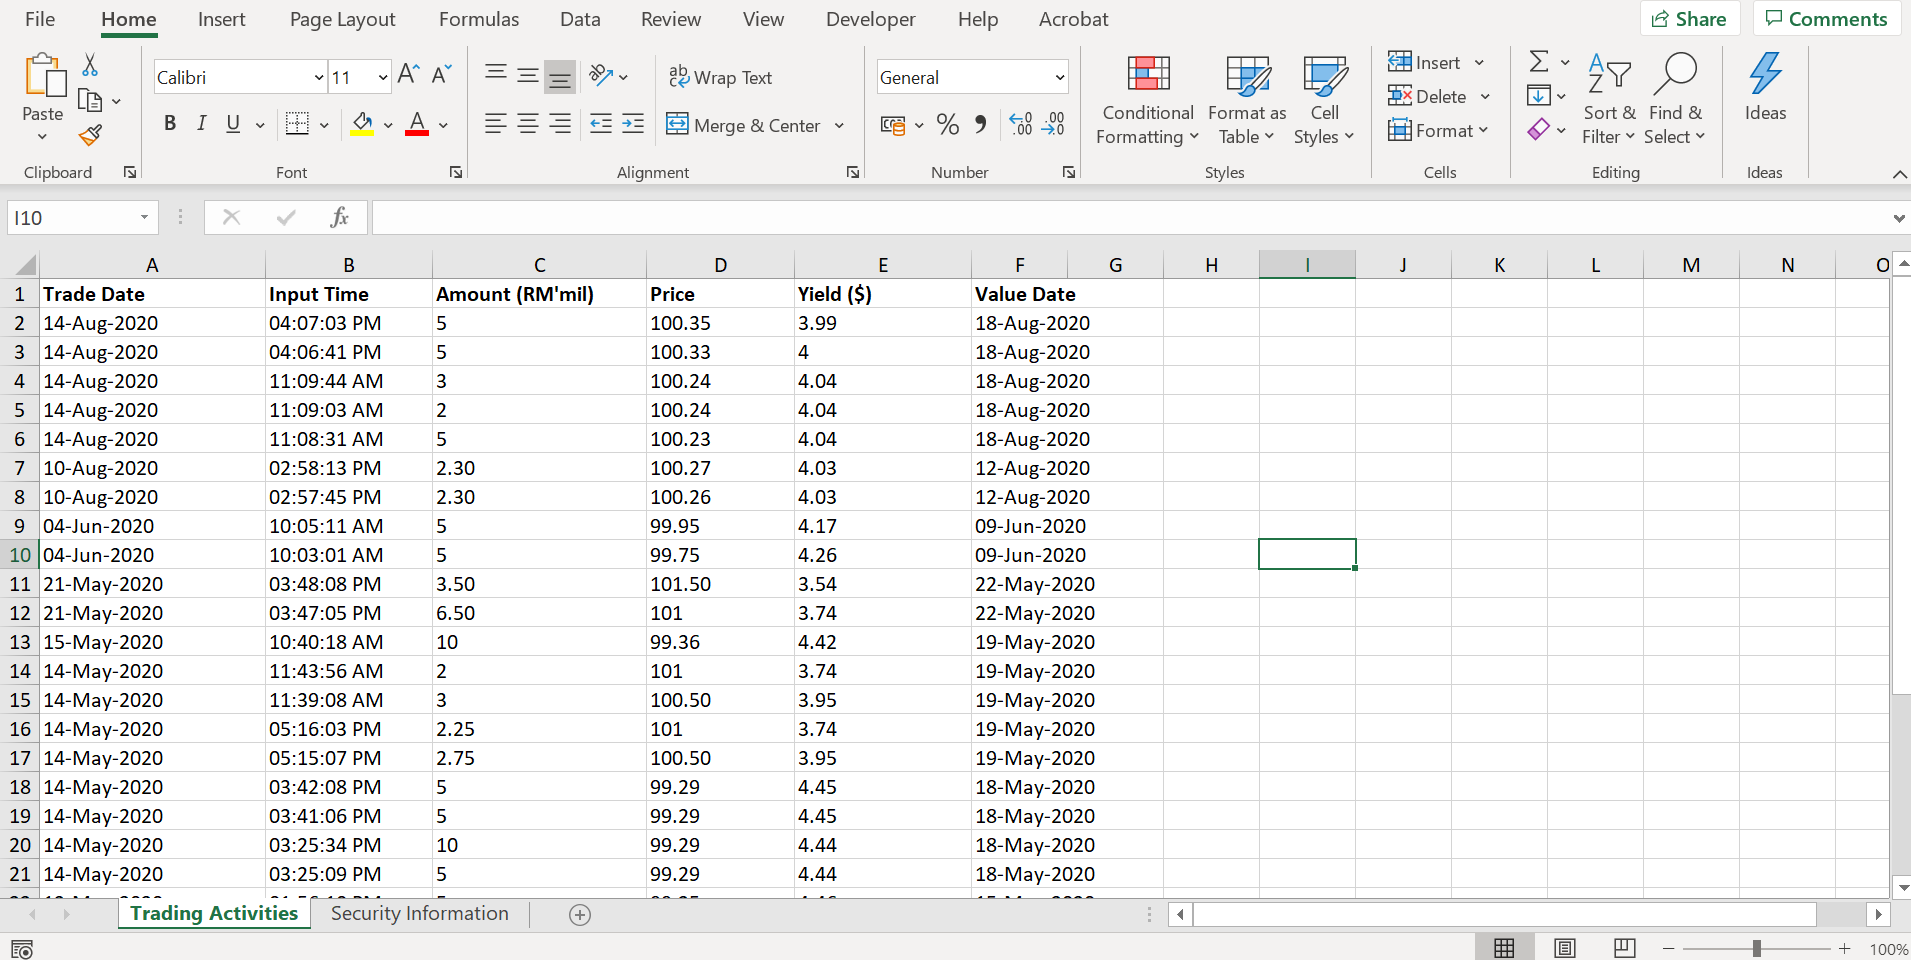.png "Figure 11: Trading Activities Exported to Excel")
Disclaimer
This report has been prepared and issued by Bond and Sukuk Information Platform Sdn Bhd (“the Company”). The information provided in this report is of a general nature and has been prepared for information purposes only. It is not intended to constitute research or as advice for any investor. The information in this report is not and should not be construed or considered as an offer, recommendation or solicitation for investments. Investors are advised to make their own independent evaluation of the information contained in this report, consider their own individual investment objectives, financial situation and particular needs and should seek appropriate personalised financial advice from a qualified professional to suit individual circumstances and risk profile.
The information contained in this report is prepared from data believed to be correct and reliable at the time of issuance of this report. While every effort is made to ensure the information is up-to-date and correct, the Company does not make any guarantee, representation or warranty, express or implied, as to the adequacy, accuracy, completeness, reliability or fairness of any such information contained in this report and accordingly, neither the Company nor any of its affiliates nor its related persons shall not be liable in any manner whatsoever for any consequences (including but not limited to any direct, indirect or consequential losses, loss of profits and damages) of any reliance thereon or usage thereof.
YOU MAY ALSO LIKE

ARTICLE
Jul 21, 2026
|
6 min read
ARTICLE
Jun 04, 2026
|
4 min read
ARTICLE
May 11, 2026
|
6 min read
ARTICLE
May 04, 2026
|
4 min read